
The UK’s fitness landscape is changing rapidly. More people are joining health and fitness clubs, gym visits are rising, and official data shows that physical activity levels in England have reached their highest point since Sport England began its current measurement system.
But the picture is not entirely positive.
Millions of adults still do not meet recommended activity levels, while major differences remain between men and women, more and less affluent communities, disabled and non-disabled people, and different age and ethnic groups. Among children, activity has also reached a record high, but fewer than half are meeting the recommended average of 60 minutes of physical activity each day.
This report brings together the latest available 2026 UK fitness-industry data and official physical-activity statistics, with a particular focus on exercise, gym participation, physical activity, obesity and changing fitness habits. For readers of Pure Peptides UK, these statistics also provide useful insight into how exercise, fitness participation and health habits are changing across the UK.
Data note: UK-wide figures are used where national fitness-industry data is available. Physical-activity statistics from Sport England and the Office for Health Improvement and Disparities (OHID) cover England unless otherwise stated. The distinction matters because England figures should not be presented as statistics for the entire UK.
1. 12.2 million people in the UK are members of a health and fitness club
The UK’s health and fitness sector reached a new membership record in the latest UK Health & Fitness Market Report 2026.
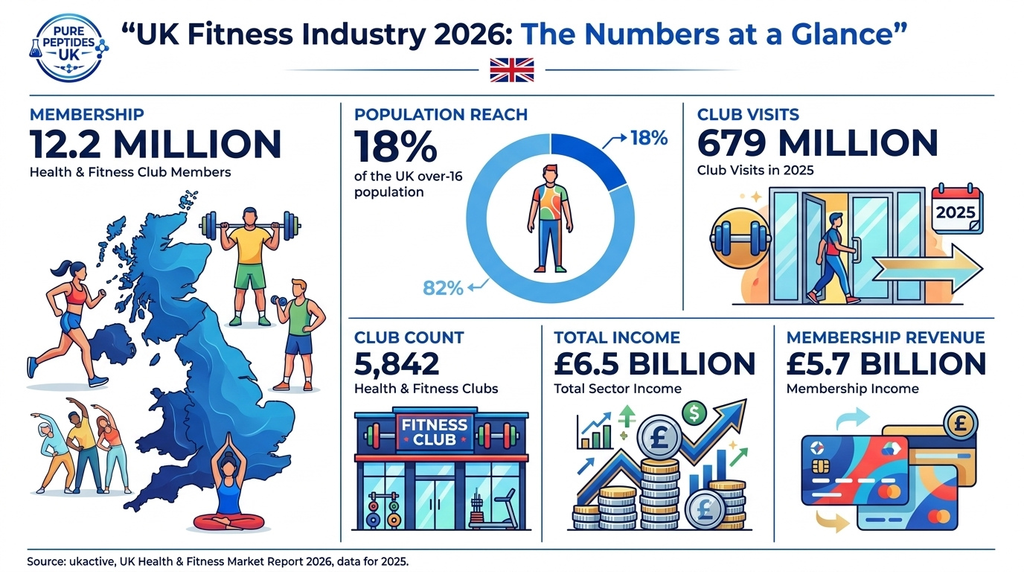
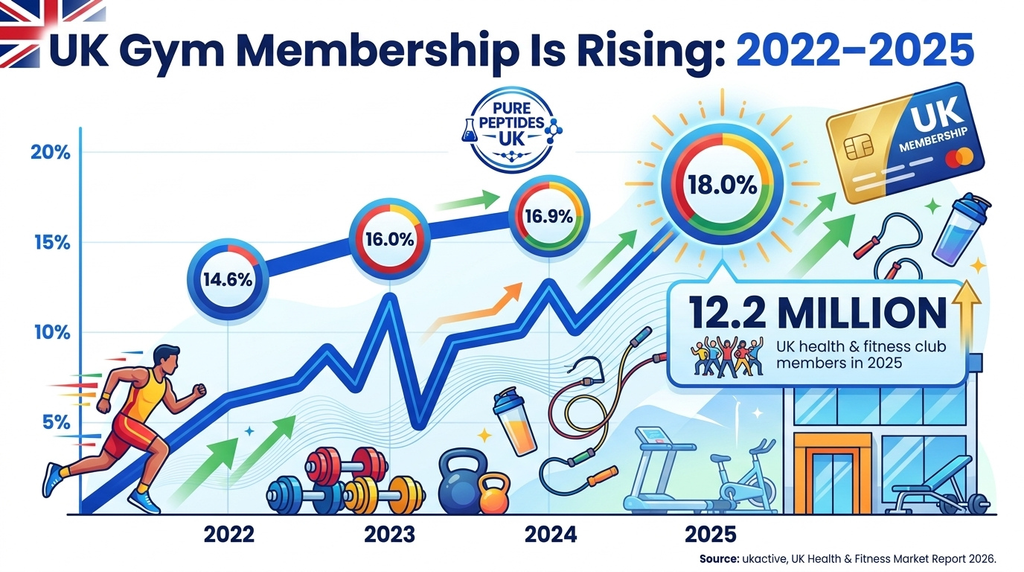
According to ukactive’s April 2026 report, 12.2 million people aged 16 and over were members of a health and fitness club in the UK in 2025.
That represents 18% of the over-16 population.
The figure is part of a continuing upward trend. Club membership penetration increased from 14.6% in 2022 to 16.0% in 2023, 16.9% in 2024 and 18.0% in 2025.
This is one of the clearest indicators that structured fitness has become a significant part of everyday life for millions of people in Britain.
2. UK health and fitness clubs recorded 679 million visits
Membership is only part of the story.
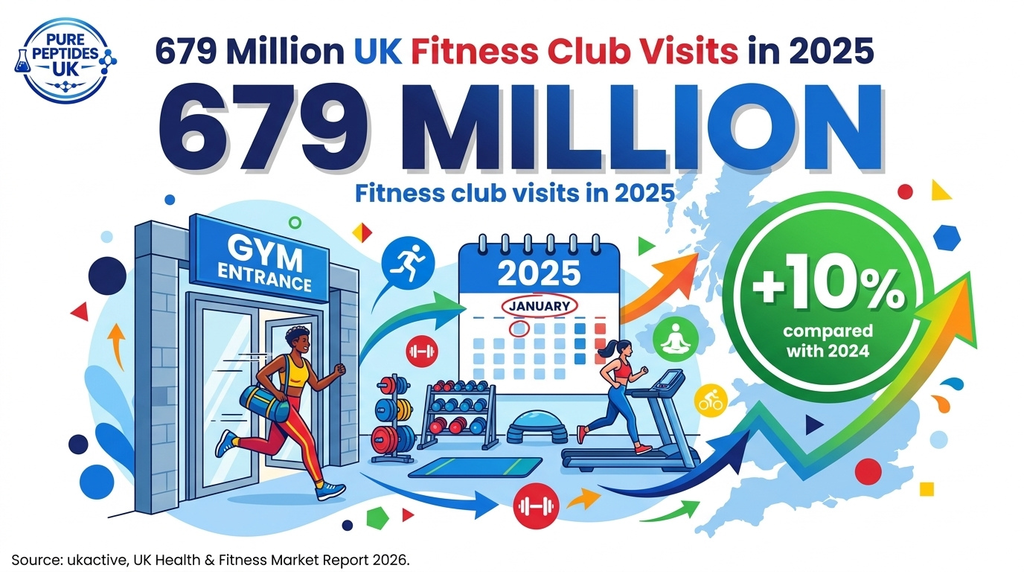
Health and fitness clubs across the UK recorded 679 million visits during 2025, according to the 2026 ukactive market report.
That represented a 10% increase compared with 2024.
The scale is significant. ukactive reported that the number of health and fitness club visits in 2025 was nearly twice the 383 million GP visits recorded in NHS data for the same period.
However, these are different types of activity and healthcare interaction, so the comparison should be understood as an indication of scale rather than a direct comparison between gym use and medical care.
3. The UK health and fitness sector generated £6.5 billion in total income
The UK’s health and fitness market continued to expand financially.
The 2026 ukactive report puts total sector income at approximately £6.5 billion, up from £5.7 billion in 2024.
This increase shows that the growth in fitness is not limited to membership numbers.
Operators are generating more income through memberships, pricing, different services and broader fitness offerings.
The report also identifies growing interest in activities and services beyond conventional gym workouts, including recovery services, social spaces and work-from-gym facilities.
4. The number of health and fitness clubs reached 5,842
The latest UK market report recorded 5,842 health and fitness clubs.
That represented a 4.2% increase from 2024.
This figure covers public, private and independent operators included in the market dataset.
It is worth noting that this figure should not be confused with older “number of gyms” estimates based on different methodologies. Fitness-industry datasets can count facilities differently depending on whether they include leisure centres, public facilities, independent operators and other types of fitness venues.
For a 2026 article, the ukactive market-report definition is therefore the more appropriate figure to cite when discussing the health and fitness club sector.
5. Gym membership penetration has increased every year since 2022
The UK’s club-membership penetration has shown a steady upward trend:
| Year | Over-16 health & fitness club membership penetration |
| 2022 | 14.6% |
| 2023 | 16.0% |
| 2024 | 16.9% |
| 2025 | 18.0% |
The latest figure means almost one in five people aged 16 and over in the UK was a health and fitness club member in 2025.
UKActive says penetration has increased by around one percentage point per year since its data collection began.
That makes the change more interesting than a single-year increase: the data points to a longer-term expansion in formal fitness participation.
6. UK fitness clubs generated £5.7 billion in membership income
Membership income alone reached approximately £5.7 billion in 2025, according to the 2026 ukactive report.
That was a 14% year-on-year increase from £5.0 billion in 2024.
The distinction between total sector income and membership income is important.
Total sector income includes the broader market, whereas membership income specifically relates to money generated from memberships.
Both measures indicate that the UK fitness sector is becoming a larger commercial market.
7. Fitness clubs generated an estimated £7.5 billion in social value
The latest report also estimates that the UK health and fitness sector generated £7.5 billion in social value.
ukactive says this measure is based on participation data combined with national models relating to wellbeing and health impacts, including life satisfaction and reduced incidence of major health conditions.
This is not the same as £7.5 billion in direct economic revenue.
It is an estimated social-value measure intended to capture wider benefits associated with participation.
That distinction is important when reporting the figure.
8. Trying new activities motivates 62% of fitness-club consumers
Fitness memberships are not necessarily driven only by traditional gym workouts.
Consumer data included in the 2026 ukactive report found that 62% of consumers identified “trying new activities” as a motivation for taking out a membership.
This suggests that modern fitness clubs are increasingly competing on variety.
The traditional model of treadmills, resistance machines and free weights now sits alongside group classes, functional training, recovery services, social spaces and other activities.
9. Making friends matters to almost half of fitness-club members
The social side of fitness is also significant.
According to the same consumer data, 49% of members said that “making friends” was important to them.
That finding helps explain why fitness facilities increasingly position themselves as social environments rather than simply places containing exercise equipment.
For some members, the attraction is not just physical activity. Community, routine and social interaction can also influence participation.
10. The UK fitness sector has set a long-term goal of reaching 20% participation
ukactive established an ambition in 2021 to have more than five million additional people regularly using gyms, swimming pools and leisure centres by 2030.
The target is equivalent to 20% of the population.
With health and fitness club membership penetration already at 18% among people aged 16 and over, the industry has moved significantly toward that goal.
However, the two figures should not be treated as exactly interchangeable because the 2030 ambition and the latest membership penetration statistic use different population definitions.
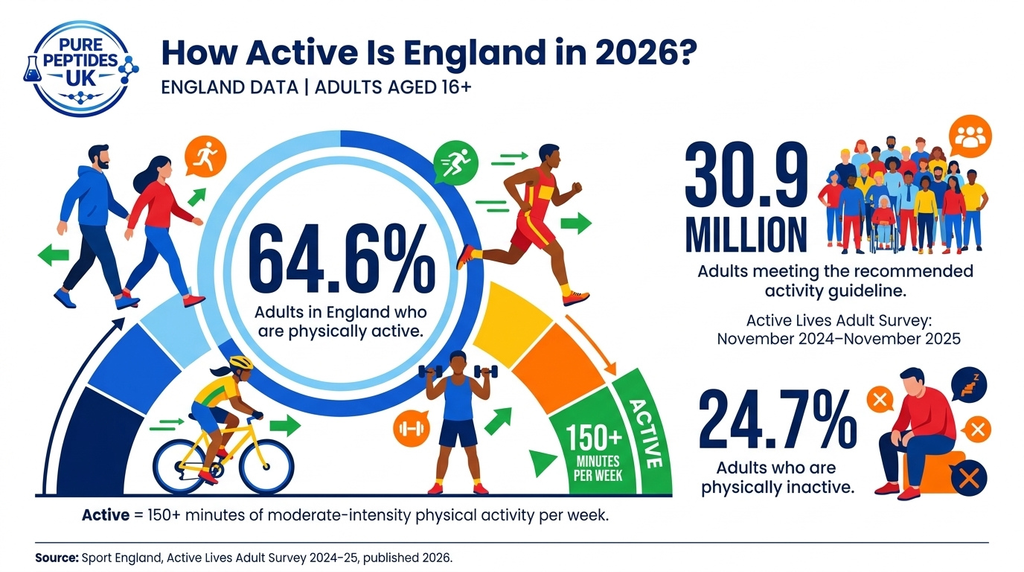
11. 64.6% of adults in England meet the recommended activity level
The latest Active Lives Adult Survey found that 64.6% of adults in England, equivalent to around 30.9 million people, met the Chief Medical Officers’ guideline of completing at least 150 minutes of moderate-intensity physical activity a week.
This is the latest national adult activity figure available from Sport England as of September 2026.
It represents an increase of 859,000 adults compared with the previous 12-month period.
The result indicates continued progress in activity levels.
But it also means that a substantial minority of adults still do not reach the recommended threshold.
12. Around one in four adults in England are classified as inactive
Sport England defines inactive adults as those completing fewer than 30 minutes of moderate-intensity-equivalent physical activity per week.
In the latest 2024-25 results, 24.7% of adults were classified as inactive.
That is down by 0.9 percentage points compared with 2015-16, showing a long-term decline in inactivity.
However, almost one quarter of adults remaining below the inactivity threshold is still a substantial public-health challenge.
It also demonstrates why rising gym membership does not automatically mean the entire population has become more active.
13. Men’s activity levels remain higher than women’s
The latest Sport England data shows a continuing gender gap.
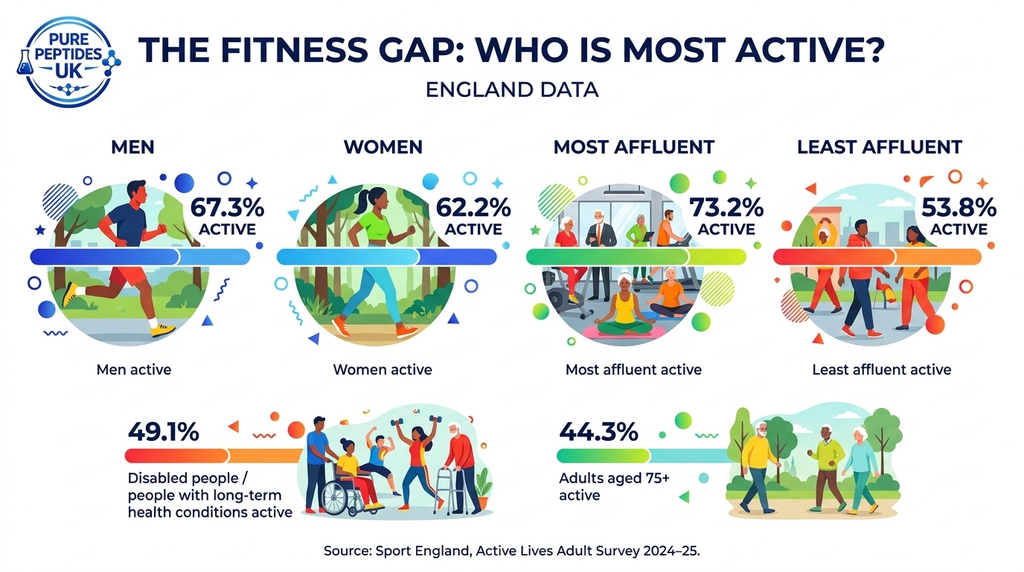
Approximately 67.3% of men were classified as active compared with 62.2% of women.
Both groups have experienced growth in activity, but the gap has remained difficult to close.
This is important when discussing Britain’s fitness trends because an overall national average can hide significant differences between demographic groups.
A rise in national participation does not necessarily mean that every group is benefiting equally.
14. Disabled adults and people with long-term health conditions have lower activity levels
The latest Sport England figures show a substantial difference based on disability and long-term health conditions.
Around 49.1% of disabled people and people with long-term health conditions were active, compared with approximately 70% of people without a disability or long-term health condition in the detailed comparison.
This represents one of the most significant activity gaps in the latest data.
It also shows why national fitness strategies cannot focus solely on gym membership or sports participation. Accessibility, health status, facilities and individual circumstances can all influence the ability to participate.
15. Activity levels differ sharply by socioeconomic background
The latest Active Lives results show a substantial socioeconomic divide.
Sport England reports that 53.8% of adults from the least affluent backgrounds were active, compared with 73.2% among the most affluent.
That is a gap of almost 20 percentage points.
The difference matters because access to physical activity can be influenced by factors beyond personal motivation, including income, local facilities, working patterns, transport, neighbourhood design and other socioeconomic conditions.
Sport England reports that the activity gap between the most and least deprived communities has widened over time.
16. Only 44.3% of adults aged 75 and over meet the activity threshold
Age is another major factor.
The latest Sport England data shows that only 44.3% of adults aged 75 and over were active.
This compares with the overall adult activity rate of 64.6%.
The finding highlights the importance of looking beyond the average national figure. Activity levels vary considerably throughout adulthood, and older age groups face different barriers and opportunities for physical activity.
17. Black and Asian adults have lower activity rates than White adults
The latest Active Lives data also identifies differences between ethnic groups.
Sport England reports activity rates of:
- 57.2% for Black adults
- 56.3% for Asian adults
These were below the rate for White adults.
These differences should not be interpreted as evidence that ethnicity itself causes inactivity.
Activity is influenced by a combination of social, economic, cultural, environmental and individual factors.
The figures instead highlight where participation gaps exist and where targeted approaches may be needed.
18. 49.1% of children in England meet the recommended activity level
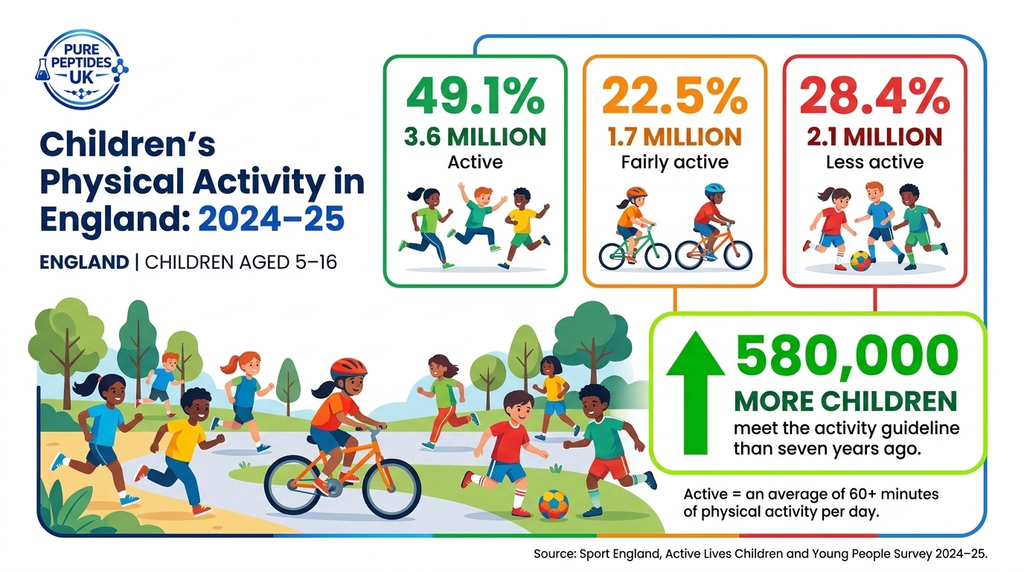
The latest Sport England children and young people survey found that 49.1% of children aged 5 to 16 in England were classified as active.
That represents approximately 3.6 million children meeting the Chief Medical Officers’ guideline of an average of at least 60 minutes of physical activity per day across the week.
It is the highest activity level recorded since the Active Lives Children and Young People Survey began in 2017-18.
But the headline also contains a warning: more than half of children still do not meet the guideline.
19. More than half a million additional children are meeting the activity guideline
Compared with 2017-18, there are now approximately 580,000 more children and young people meeting the recommended activity level.
Sport England reports this as an increase of 5.8% over the seven-year period.
The improvement is particularly notable because activity patterns were heavily disrupted by the COVID-19 pandemic.
The latest figures suggest that the recovery has developed into a longer-term improvement rather than simply returning to the pre-pandemic position.
20. 28.4% of children are still classed as less active
Despite the improvement, 28.4% of children and young people, around 2.1 million, were classified as less active.
Sport England defines this group as averaging less than 30 minutes of physical activity per day.
Another 22.5%, around 1.7 million, were classified as fairly active, averaging 30 to 59 minutes per day.
That leaves 49.1% meeting the 60-minute guideline.
The distribution therefore looks like this:
| Activity level | Share | Approx. number |
| Less active | 28.4% | 2.1 million |
| Fairly active | 22.5% | 1.7 million |
| Active | 49.1% | 3.6 million |
21. Boys remain more active than girls
The latest children’s data shows a persistent gender difference.
In 2024-25:
- 52% of boys were active
- 46% of girls were active
Both figures improved compared with the previous year, with girls increasing from 45% to 46% and boys from 51% to 52%.
The improvement among girls is important because Sport England says the gender gap has narrowed slightly over both the latest year and the longer-term period.
However, girls still remain less likely than boys to meet the recommended activity level.
22. Gym and fitness participation among children has more than doubled since 2017-18
One of the most interesting trends in the children’s data is the growth in gym and fitness participation.
Sport England reports that participation in gym and fitness increased from 11% in 2017-18 to 24% in 2024-25.
That means the proportion participating in gym or fitness activities has more than doubled over the period.
This does not mean children are necessarily spending more time in traditional commercial gyms. The category covers gym and fitness participation within the survey’s activity classification.
Nevertheless, it indicates a substantial long-term shift toward fitness-based activity among young people.
23. Active travel among children has increased substantially
Walking, cycling and scootering are also becoming a larger part of children’s physical activity.
The latest Sport England report shows active travel participation rising from 47% in 2017-18 to 61% in 2024-25.
Sport England estimates that there are now 1.2 million more children and young people, or 13.7% more, travelling actively than seven years earlier.
Active travel matters because it incorporates movement into daily routines rather than requiring people to schedule a separate workout.
24. Activity levels remain strongly connected to family affluence among children
The latest children’s survey shows another major inequality.
Only 45% of children from the least affluent families met the recommended activity level, compared with 58% of children from the most affluent families.
This 13-percentage-point difference demonstrates that the UK’s fitness challenge is not simply about individual motivation.
Family circumstances, access to facilities, local environments and other social factors can all influence children’s opportunities to be active.
Sport England reports that activity levels among children from the least affluent families have not increased at the same pace as those from more affluent groups, contributing to a widening short-term gap.
25. The latest fitness statistics show a UK that is more active, but still highly unequal
Taken together, the latest figures tell a more complicated story than either a fitness boom or a national health crisis.
The positive side is clear.
The UK health and fitness sector now has 12.2 million club members, recorded 679 million visits in 2025, and reached 18% membership penetration among people aged 16 and over.
In England, 64.6% of adults met the recommended activity threshold in the latest Active Lives survey, representing around 30.9 million people.
Children’s activity has also reached its highest recorded level, with 49.1% meeting the 60-minute guideline.
But major gaps remain.
Almost one quarter of adults are still classified as inactive. Women are less likely to be active than men. Disabled adults and people with long-term health conditions have substantially lower activity rates. Older adults have lower activity levels, and people in less affluent communities are much less likely to meet recommended activity levels.
Among children, fewer than half meet the recommended daily activity level, and children from less affluent families continue to have lower participation.
The biggest lesson from the 2026 data is therefore not simply that Britain is becoming fitter.
It is that fitness participation is growing while access and participation remain uneven.
What the 2026 UK Fitness Statistics Tell Us
The latest data points to five major trends.
1. Gym participation is growing
The UK fitness industry is larger than it was several years ago. Membership, visits, income and the number of clubs have all increased according to the latest ukactive market report.
2. Overall physical activity is improving
England’s latest Active Lives Adult Survey shows that 64.6% of adults met the recommended 150-minute activity threshold, up from the previous year.
3. Children’s activity has reached a record high
Almost half of children are now meeting the 60-minute daily average guideline, and more than half a million additional children are doing so compared with 2017-18.
4. Fitness is becoming more diverse
The growth of gym and fitness participation among young people, alongside active travel and broader club offerings, suggests that physical activity is no longer limited to traditional sports or conventional gym sessions.
5. Inequality remains the biggest challenge
The national averages hide major differences.
Activity levels remain lower among women than men, among disabled people and people with long-term health conditions, among older adults, and among people living in less affluent communities.
For children, the same pattern appears across gender, ethnicity and family affluence.
How Reliable Are These UK Fitness Statistics?
Not all fitness statistics are produced in the same way.
For this article, priority has been given to official government statistics and major industry datasets rather than secondary fitness blogs or unsupported market estimates.
The main sources are:
- Sport England Active Lives Adult Survey for physical activity among adults aged 16 and over in England.
- Sport England Active Lives Children and Young People Survey for children aged 5 to 16.
- Office for Health Improvement and Disparities (OHID) for obesity, physical activity and nutrition indicators in England.
- ukactive’s UK Health & Fitness Market Report 2026, produced with Sport England, 4GLOBAL and Grant Thornton UK, for UK health and fitness market data.
Sport England’s adult survey measures activity using moderate-intensity-equivalent minutes. Adults completing at least 150 minutes per week are classified as active, those completing 30 to 149 minutes as fairly active, and those completing fewer than 30 minutes as inactive.
For children, the measurement is different. The active threshold is an average of 60 minutes or more of physical activity per day across the week.
These differences matter when comparing figures.
UK Fitness Statistics vs England Fitness Statistics
One of the easiest mistakes in fitness-statistics articles is using an England statistic and calling it a UK statistic.
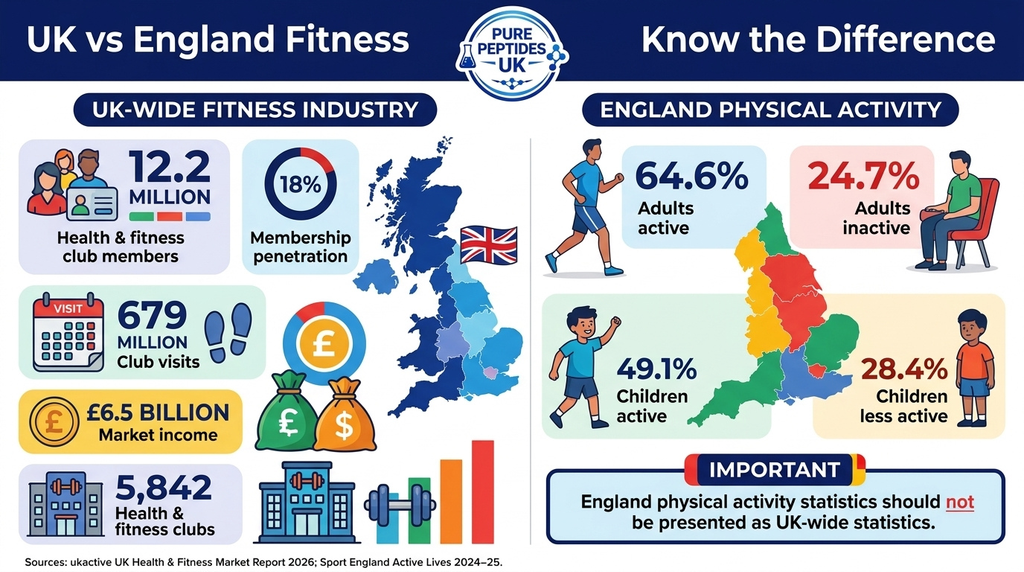
The latest ukactive market report provides UK-wide health and fitness club figures, including the 12.2 million members and 679 million visits reported for 2025.
Sport England’s Active Lives surveys, however, cover England.
Therefore, the statement:
“64.6% of UK adults are physically active”
would be inaccurate if it is based on the latest Active Lives Adult Survey.
The accurate statement is:
“64.6% of adults in England met the recommended activity level in the latest Active Lives Adult Survey.”
This distinction is particularly important for an article claiming to provide real UK statistics.
What Could Change in the Next UK Fitness Statistics Report?
The fitness sector is still evolving.
The latest ukactive figures show strong growth in membership and visits, while Sport England’s data shows continued improvement in physical activity.
At the same time, the biggest gaps are concentrated among groups that often face greater barriers to participation.
Future fitness statistics will therefore be important for answering several questions:
- Will UK club membership reach 20% penetration?
- Will gym visits continue increasing?
- Will adult inactivity continue to fall?
- Can the gender activity gap narrow?
- Can activity levels among older adults improve?
- Can the gap between affluent and deprived communities be reduced?
- Will children’s activity continue rising?
- Can fewer than half of children meeting the recommended activity level become a majority?
- Will gym and fitness participation among young people continue its rapid growth?
- Will active travel continue to increase?
These questions matter because a healthy fitness sector is not measured only by how many memberships are sold.
It is also measured by whether more people are actually moving, whether participation is accessible, and whether improvements reach communities that have historically been less active.
Final Takeaway
The latest 2026 UK fitness statistics show a sector experiencing significant growth.
Health and fitness club membership has reached 12.2 million, equivalent to 18% of people aged 16 and over. UK clubs recorded 679 million visits in 2025, while total sector income reached approximately £6.5 billion.
England’s latest physical-activity data is also encouraging. 64.6% of adults, or around 30.9 million people, met the recommended 150-minute weekly activity threshold in the November 2024 to November 2025 period.
Children’s activity has reached its highest level since the Active Lives survey began, with 49.1% meeting the recommended average of 60 minutes per day.
Yet the data also exposes a major challenge.
Fitness participation is not evenly distributed. Women, older adults, disabled people, people with long-term health conditions and people from less affluent communities remain less likely to meet recommended activity levels. Similar inequalities appear among children.
So the biggest story in Britain’s 2026 fitness data is not simply that more people are joining gyms.
It is that the UK’s relationship with exercise is changing, but the benefits of that change are still not being shared equally.
For researchers, fitness professionals, policymakers and businesses operating in the health and fitness space, these statistics provide a useful snapshot of where Britain stands today and where the biggest opportunities and challenges may emerge next.
Data and methodology note: Statistics in this article reflect the latest available releases identified as of September 2026. UK-wide fitness-industry figures and England-only physical-activity statistics are clearly distinguished. Where survey definitions differ, figures should not be directly combined or treated as interchangeable.
Primary sources: ukactive UK Health & Fitness Market Report 2026; Sport England Active Lives Adult Survey November 2024-25; Sport England Active Lives Children and Young People Survey 2024-25; Office for Health Improvement and Disparities Obesity, Physical Activity and Nutrition Profile, May 2026.